
Do you speak Hadoop? A Review of the Latest Tech in Big Data and Uses for HR Practitioners
By Maira Compagnone, Jessie Harris, and Philip Hinson

“Big Data,” or the compilation of large datasets that can identify trends and predict future outcomes or behaviors, is becoming more commonplace in industries globally. Big data consists of five main dimensions: a) volume, representing the amount of data; b) velocity, representing the speed of data streams; c) variety, representing the different types of data and sources; d) variability, in regards to the speed and amount of data coming in; and e) complexity, representing the differences of data across platforms (Statistical Analysis Software [SAS], 2019). Despite many organizations not yet tapping into the benefits of big data, the amount of information generated each day is increasing exponentially. About 1.7 megabytes of new information is generated every second for every individual on the planet (Monnappa, 2020).
Organizations that are utilizing big data and advanced data technologies are more profitable than those that are not (McAfee & Brynjolfsson, 2012). For instance, the University of Murcia in Spain has rolled out an artificial intelligence enabled chatbot to answer students’ questions. It was able to answer more than 38,708 questions with 91% accuracy (Rouhiainen, 2019), reducing labor costs as staff could be reallocated to more important tasks. Big data has also made its way into the healthcare industry, where organizations such as the University of Chicago Medical Center have used algorithms to decrease the wait time in between operations by 20%. Financial institutions, such as Mastercard, are even able to use big data to predict political or civil unrest with accuracy that our government cannot match (Nash, 2016). Despite its growing popularity across industries globally, human resources has had difficulty with the application of analytics.
So why does human resources (HR) struggle with utilizing the vast amount of organizational, performance, and human capital information they have at their fingertips? First, because HR is a support function, they typically shop around for the most cost effective and efficient data platforms, regardless of whether the data systems integrate easily or not. Additionally, much of the data that HR practitioners have access to is confidential, leading to issues of legality and privacy. This is especially true for multinational corporations that must be aware of data governance laws globally. Finally, answering questions with human variables is difficult. Humans simply are not as predictable as machines.
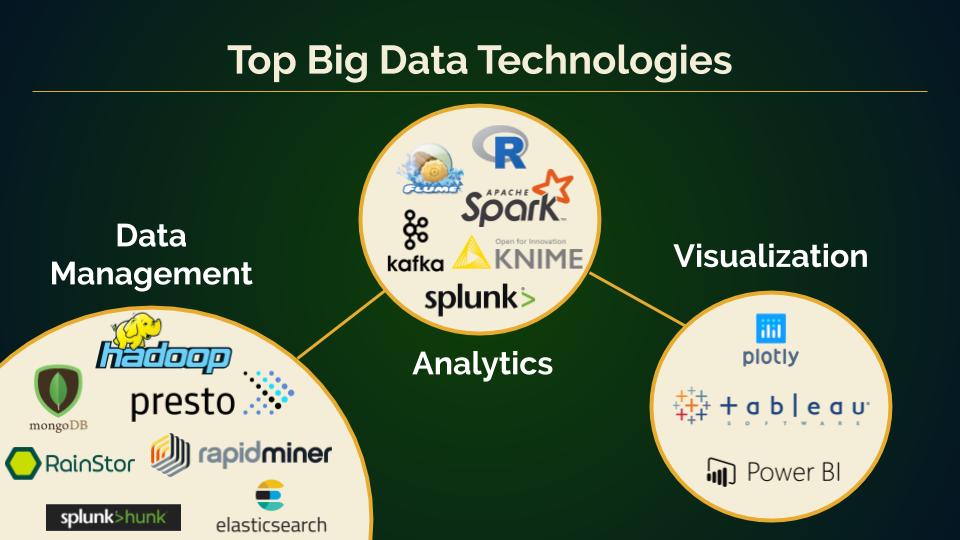
In order to find insights through big data, HR must focus on decision-worthy questions. By establishing an important business question, identifying the variables of importance, and applying advanced methodologies and technology, HR can add significant value to their organizations by using big data. This article will provide practitioners with an understanding and overview of the top trending technologies that can be used to facilitate data management, analytics, and data visualization.
Data Management
Data management is the process of preparing data for analysis. It consists of data collection, storage, and harmonization, which is how different data are brought together to conduct analytics and answer questions.
Traditionally, organizations have stored their data in relational, or SQL, databases. This type of database contains two or more tables that have defined relationships between them. Within these tables, data are stored in rows and columns, with each column containing a specific data type (Ramachandran, 2014). An example of a relational database in the quintessential Microsoft Excel © spreadsheet. Overall, this method of data storage is structured and unchanging, meaning that it is reliable and easy to understand. However, the inflexible nature of this method limits its performance and ability to handle extremely large amounts of data (Foote, 2016). Despite this, relational databases are at the backbone of most HRIS systems and can easily manage the amounts of data most HR practitioners deal with. Nearly all HR practitioners have used spreadsheets to track various data around employees and there are tools within Excel ©, such as pivot tables and vlookups, that allow for basic data manipulation.
When it comes to handling big data, relational databases often cannot meet the required level of processing. Instead, organizations tend to utilize non-relational, or NoSQL, databases. These systems do not store data in tables with traditional rows and columns. Rather, the data has no structure, meaning different forms of data are stored together. For example, you may need to store a huge collection of images, videos, or documents, such as resume pdfs. Attempting to store these data traditionally would be inefficient and time consuming. Instead, they can be stored in a data lake, or a large collection of unstructured data (Maronto, 2019). One popular tool that allows you to create and manage data lakes is Hadoop. Another tool, such as rapidminer, can then be used to retrieve data from Hadoop and other data stores and apply traditional SQL structure to the data, harmonizing it for analysis. Two additional popular programs for retrieval and applying structure are Presto and Spark SQL. While Presto tends to be easier to set up, Spark SQL has a larger community available for support and also tends to perform queries a bit quicker.
Non-relational databases are optimized for big data due to their scalability. However, with this increased flexibility comes less reliability and consistency compared to relational databases (Wodehouse, 2019). Data retrieved from NoSQL storage may contain errors or be organized incorrectly. Even so, by using these data management methods, organizations can engage in more advanced data collection and manipulation, such as setting up a continuous stream of recruitment website data based on job ad interaction and application completion. Whether an organization uses traditional methods or big data methods to manage data depends on their needs and the business questions at hand.
Data Analytics
Analytics is most simply described as the process of transforming data into insights that can be used to make better decisions. There are four levels of data analytics that build upon each other to progressively improve the decision making process: descriptive, diagnostic, predictive, and prescriptive analytics. Descriptive analytics is used to reflect what has happened in the past by providing a snapshot of points in time. This is done using static statistics or metrics many practitioners may already be familiar with, such as means or standard deviations. Diagnostic analytics goes further by beginning to examine why something in the data occurred through tools such as regression. Predictive analytics uses models or results to predict what will happen in the future based upon what has been seen in the past. This is where forecasting techniques begin to become relevant. Finally, prescriptive analytics aims to figure out how to realize the outcomes you want to occur.
Within HR, it is typical to see the use of descriptive analytics and some use of diagnostic analytics, but many times there is a failure to go further into predictive and prescriptive analytics. This may be due to a lack of sufficient data or understanding of how to complete and interpret these levels of analysis. As big data becomes more readily available within various areas of HR, however, it will be pertinent to grasp what these types of analyses can offer.
There are many buzzwords that begin to surface when advanced modeling and analytics are discussed, such as artificial intelligence, or deep and machine learning. These concepts are boasted as being pivotal in the analysis of big data, and this is most likely true, despite many people not understanding what these terms mean. Artificial intelligence, machine learning, and deep learning are simply a nested set of ways to utilize technology for more efficient and effective decision-making (Hao, 2018).
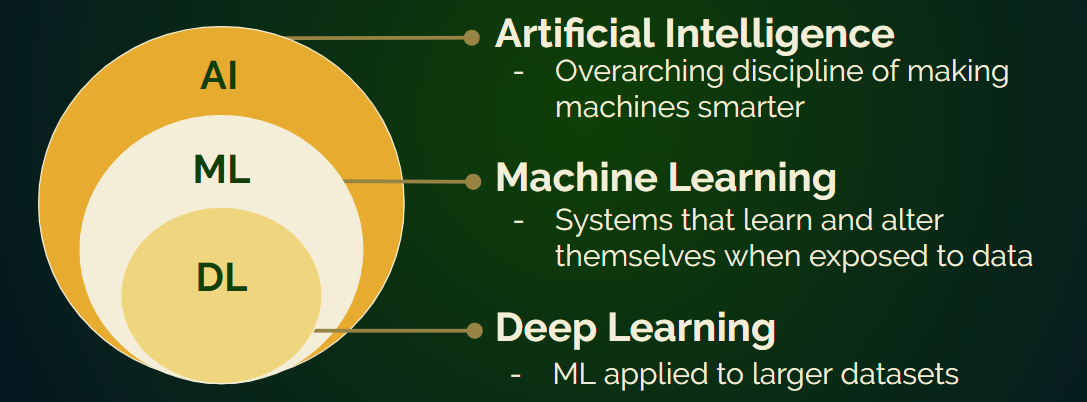
Artificial intelligence is the overarching discipline for the other terms, referring to anything done to make machines smarter. It could be as simple as providing a regression equation to a system and allowing the machine to use the equation to predict an outcome using the data it has. In effect, the machine is now making a smarter, more informed decision. Machine learning is a subtype of artificial intelligence where systems learn and alter themselves as they are exposed to more data. In this case, you may start with a regression equation that a machine uses for the prediction of a value, but as the system processes more data for prediction and sees the actual outcomes, it automatically updates the equation to provide better prediction results in the future. Finally, deep learning simply refers to when machine learning is applied to even larger data sets. All of these methods allow for data analytics to be accomplished more efficiently and continuously, with large amounts of data. They will not allow for the use of higher level analytics alone, but they do make the processing of big data more practical.
There are many analytics tools available that can accomplish various levels of artificial intelligence and machine learning. Some of the most popular and well known are Python, SAS, R, and Apache Spark (Van Vulpen, 2020). Python is a coding language that is ideal for some of the more sophisticated modeling. SAS is statistical analysis platform that offers both coding and point-and-click options for business analyses. While some capabilities may be more limited than other platforms, SAS is an established product with a dedicated customer support team and many official resources available online. R is another coding language that is particularly strong in statistical analysis. R’s main benefits include it being zero-cost and open-source, and the availability of highest quality visualizations. Finally, Apache Spark is an analytics platform ideal for processing continuous streams of data, allowing for real-time analysis. In deciding which tool is best for your organization, it is important to consider what the tool will be used for and whether your organization is already making use of a specific program in other departments. If there is already a preferred tool that has been invested in, it may be ideal to use that technology to take advantage of people in your organization that are already experts in its use. In addition, this could limit the financial burden of adding the program to HR’s arsenal.
Data Visualization
Data visualization is vitally important to HR practitioners. It allows results to be conveyed more effectively and easily to senior leadership. To maximize the effectiveness of data visualizations, practitioners should focus on a) the target audience, b) the type of visualization that most aligns with the content, and c) the context or purpose of the message (Digiteum, 2019).
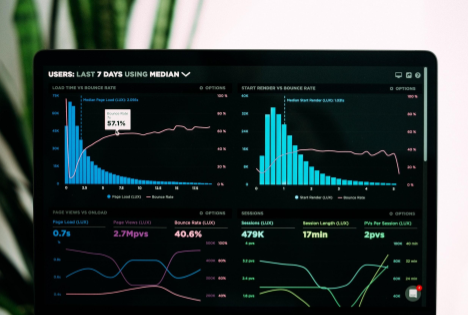
Many visualizations that practitioners need to build, such as bar graphs, plots, charts, and diagrams, can be made easily using Microsoft Excel © or similar platforms. For predictive or prescriptive analytics visualizations, interactive dashboards provide the most accurate information, due to their ability to update in real-time. These dynamic dashboards can change information output based on clickable selections, and are extremely valuable to practitioners (Lloyd, 2020). These dashboards contain all human capital variables so that leaders and practitioners across locations can gain insights into employee performance. For example, an HR business partner can keep an eye on their line of business while traveling to and from global headquarters. Any changes to recruitment, turnover, training, and performance will be easily visible to HR, managers, and leadership alike.
Tableau, Microsoft PowerBI, and Visme are the best technologies suited to beginners. PowerBI has a free version and sample datasets for practitioners to play with and gain proficiency before making an investment in the larger packages. Many visualization software packages also have the ability to run analytics (Plotly, Sisense, or IBM Cognos Analytics) and the more popular platforms are able to run analytics as advanced as coding packages (Power BI, Kibana, and Grafana). Most of these technologies connect easily to other programming languages, have both cloud and desktop options, and have extensive product support and user communities to aid in troubleshooting and learning.
Conclusion
All organizations and HR departments can benefit from utilizing data. Often times, the traditional methods of data management, analytics, and visualization are enough to address business questions and assist decision makers. However, more and more organizations are looking into the potential value that big data analysis can add to their decision-making processes. If you are interested in preparing your organization for an investment in big data analytics, here are several pieces of advice:
Have a business question - Time and resources spent on data collection and analysis should be purposeful and directed. Start with a question that will lead to an actionable answer that adds business value.
Assess what you currently have - Take stock on the data you are currently tracking and data management systems your organization currently has in place. Assess what analyses are currently possible and what would be possible with more/different data.
Prepare for big data - The infrastructure, both hardware and software, that big data requires can constitute a hefty investment. Communicate with IT experts in your organization and formulate a plan to set up an adequate system.
Start with free and easy tech - As previously mentioned, many of these technologies are open source or free. Any practitioner can begin using these technologies with small datasets, or the sample datasets that the platform provides, to gain proficiency and confidence before running analytics or building dashboards.
Use data scientists from your company - Data science is a growing field, and many organizations are already utilizing these technologies within production or privacy and security. HR practitioners can use these experts as resources as they explore available technologies and learn how to best use them to gain value from their datasets.
 Maira Compagnone is a second-year graduate student in the Industrial-Organizational Psychology and Human Resource Management (IOHRM) program, and is also pursuing an MBA. Before entering the IOHRM program, she received a Bachelor's degree in Philosophy from the University of Massachusetts, Boston. She currently works with Dr. Shawn Bergman in the Professional Education program, and leads students in HR Science's Research Team to assess data capabilities and organizational analytics readiness. Click here for Maira’s LinkedIn profile.
 Jessie Harris is a second-year graduate student in the Industrial-Organizational Psychology and Human Resource Management (IOHRM) program, and is also pursuing a graduate certificate in Data Analytics. Before entering the IOHRM program, she received a Bachelor's degree in Psychology from Appalachian State University. She currently leads students in HR Science's Research Team and provides analytical program evaluation for the federal college access program, GearUp. Click here for Jessie’s LinkedIn profile.
 Philip Hinson is a second-year graduate student in the Industrial-Organizational Psychology and Human Resource Management (IOHRM) program, and is also pursuing a graduate certificate in Data Analytics. Before entering the IOHRM program, he received Bachelor's degrees in History and Psychology from the University of North Carolina at Charlotte. He currently leads students in HR Science's Research Team, using R and SAS to identify safe work initiatives and prevent injuries and fatalities within manufacturing. Click here for Philip’s LinkedIn profile.
References
Digiteum. (2019, December 18). Data visualization techniques and tools. Retrieved from https://www.digiteum.com/data-visualization-techniques-tools
Foote, K. (2016). A review of different database types: Relational versus non-relational. Retrieved from https://www.dataversity.net/review-pros-cons-different-databases-relational-versus-non-relational/#
Hao, K. (2018, November 17). What is machine learning?. Retreived from https://www.technologyreview.com/s/612437/what-is-machine-learning-we-drew-you-another-flowchart/
Lloyd. (2020). Developing the Dashboard: The Importance of Real-Time Visibility in HR. Retrieved from https://www.hrtechnologist.com/articles/performance-management-hcm/developing-the-dashboard-the-importance-of-realtime-visibility-in-hr/
McAfee, A., & Brynjolfsson, E. (2012). Big Data: The Management Revolution. Harvard Business Review. Retrieved from https://hbr.org/2012/10/big-data-the-management-revolution
Maronto, C. (2019). A data lake architecture with Hadoop and open source search engines : Using enterprise data lakes for modern analytics and business intelligence. Retrieved from https://www.searchtechnologies.com/blog/search-data-lake-with-big-data
Monnappa, A. (2020, January 10). Data Science vs. Big Data vs. Data Analytics. Retrieved from https://www.simplilearn.com/data-science-vs-big-data-vs-data-analytics-article
Nash, K. S. (2016, March 30). MasterCard Moves to Patent Analytics Work That Predicts Political Events. Retrieved from https://blogs.wsj.com/cio/2016/03/30/mastercard-moves-to-patent-analytics-work-that-predicts-political-events/
Ramachandran, M. (2014). Relational vs. non-relational databases - Part 1. Retrieved from https://bigdata-madesimple.com/relational-vs-non-relational-databases-part-1/
Rouhiainen, L. (2019, October 14). How AI and Data Could Personalize Higher Education. Retrieved from https://hbr.org/2019/10/how-ai-and-data-could-personalize-higher-education
Statistical Analysis System [SAS] (2019). Big data: What it is and why it matters. Retrieved August 27, 2019, from https://www.sas.com/en_us/insights/big-data/what-is-big-data.html.
Van Vulpen, E. (2020). Top 9 HR analytics tools. Retreived from https://www.analyticsinhr.com/blog/hr-analytics-tools/
Wodehouse, C. (2019). SQL vs. NoSQL databases: What’s the difference? Retrieved from https://www.upwork.com/hiring/data/sql-vs-nosql-databases-whats-the-difference/
Disclaimer: The views and opinions expressed in this article are those of the author and do not necessarily reflect the official policy or position of the IOHRM program, Departments of Psychology and Management, Colleges of Arts and Sciences and Business, and Appalachian State University.